- Share on Facebook
- Share on Twitter
- Share by Email
Methodology and Sources: Open Data Enables the Public Transport Atlas
The Public Transport Atlas is based on the timetable data, as of the year 2023. This cooperative network DELFI organizes the pooling of timetable information from all federal states and makes it available for free use. The data is available in GTFS format (General Transit Feed Specification). GTFS has established itself as the global standard for timetable data. It is versatile and forms the basis for many commercial, as well as non-commercial and scientific applications in the field of public transport.
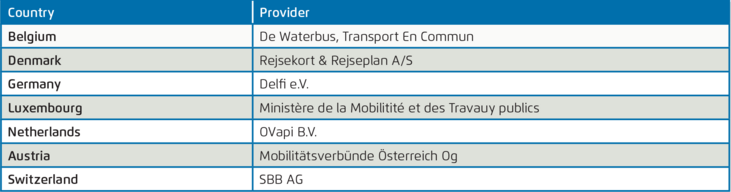
The current edition of the Public Transport Atlas includes data from Germany and, for the first time, information on public transport in its neighbouring countries Belgium, Denmark, Luxembourg, the Netherlands, Austria, and Switzerland. The selection of neighbouring countries was based on the availability and quality of the respective national data. The following sources were used for the national GTFS data:
On behalf of Agora Verkehrswende, Plan4better GmbH, which specializes in accessibility analyses, calculated the average daily values for stops using georeferencing based on the planned timetable data with the GOAT tool. The departure information refers to a weekday (sum Monday to Sunday divided by seven). The number of daily departures at the stops is related to the size of an area (for example, a municipality). To ensure that the information on trip density is not distorted by forests, farmland, or lakes, all departures within a spatial unit were only related to its settlement and traffic area.
In addition to the timetable data, various structural data were also considered for the study. Where possible, data sources were used for all countries examined that are comparable in terms of resolution, collection method, and currency. Moreover, the data was captured as much as possible according to the spatial levels of local administrative units (LAU) and the Nomenclature of Territorial Units for Statistics (NUTS) commonly used in Europe. The LAU level corresponds to municipalities in all countries, and the NUTS-3 level corresponds e.g. to counties and independent cities in Germany. The data was primarily sought at the LAU level. In some cases, it was not possible to obtain information on car density at this level. In such cases, data was captured at the NUTS level or at the level of locally available registration districts and subsequently transferred to the LAU level. For the capture of land use, the harmonized European land use data Corine Land Cover was used, which shows the type of use from a size of 0.25 km². Generally, this is sufficient, although it may happen that, especially in sparsely populated areas, land use is not fully captured. The methodology can lead to almost undeveloped spatial units (for example, a forest) having a few public transport trips and thus achieving very high trip densities – although in practice, there is neither a good public transport offer nor a demand for it. Spatial units with a built-up area smaller than 0.25 km² were therefore generally not included in the analysis and are marked as "insufficient data" in the map representation.
The table below can be referred to for the data breakdown used in each case.
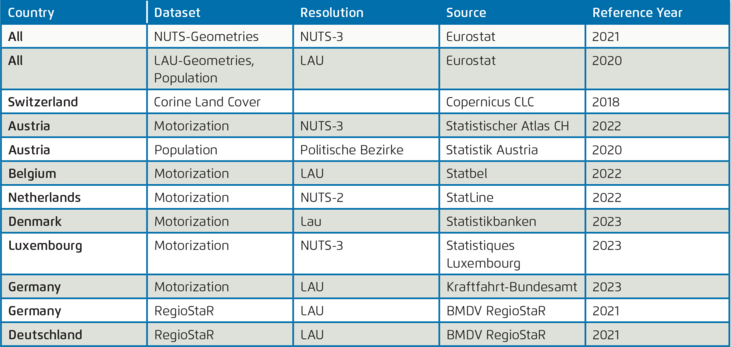
For car density, data on privately registered cars is used. The information from the individual countries is largely, but not completely, comparable due to differing statistical recordings of commercial and private cars.
The resulting geographical datasets are presented online using the MapBox platform. Not depicted are flexible transport services (On-Demand) that transport passengers without a timetable.